How to Read Financial Statements
John Tracy & Tage Tracy
 GENRE: Business & Finance
 PAGES: 240
 COMPLETED: October 6, 2021
 RATING:


Short Summary
John and Tage Tracy team up to break down and simplify intimidating financial statements. By the end of the book, readers will be able to interpret financial statements and get a good understanding of how a business is performing. The authors also take a look at how the three primary financial statements — the income statement, balance sheet, and cash flow statement — interact closely with each other.
Key Takeaways


Favorite Quote
"Cash inflows and outflows are the pulse of every business. Without a steady cash flow, a business dies."
Book Notes 
*Did not take chapter-by-chapter notes on this one. Running list below.
- Quote: “Cash inflows and outflows are the pulse of every business. Without a steady cash flow, a business dies.”
- It takes good management to make profit consistently, secure capital, and stay out of financial trouble
- This is a theme from many books I’ve read. Good management is critical.
- It takes good management to make profit consistently, secure capital, and stay out of financial trouble
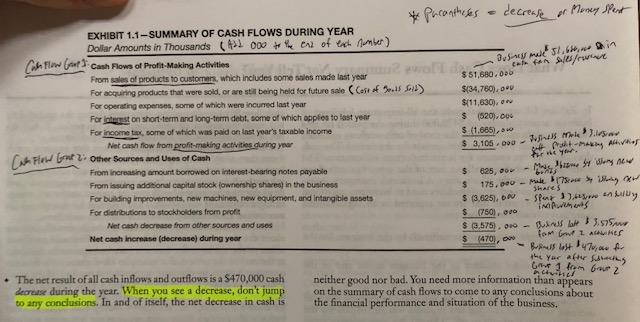
- A statement of cash flows is separated into two groups
- Group 1: Cash Flows from Profit-Making Activities
- Ex. Sales, COGS, interest payments on debt, income tax, operating expenses
- Group 2: Other Sources and Uses of Cash
- Ex. Expenses on new buildings, equipment, money raised from issuing new stock or bonds
- Group 1: Cash Flows from Profit-Making Activities

- Although useful, the cash flow statement is limited
- It doesn’t accurately show net profit because the starting sales number is usually off due to incoming payments that haven’t been collected yet
- Income Statement does this accurately
- It doesn’t accurately show the financial condition of the business, which requires an in-depth look at the company’s assets and liabilities
- Balance Sheet does this accurately
- It doesn’t accurately show net profit because the starting sales number is usually off due to incoming payments that haven’t been collected yet
- Income Statement
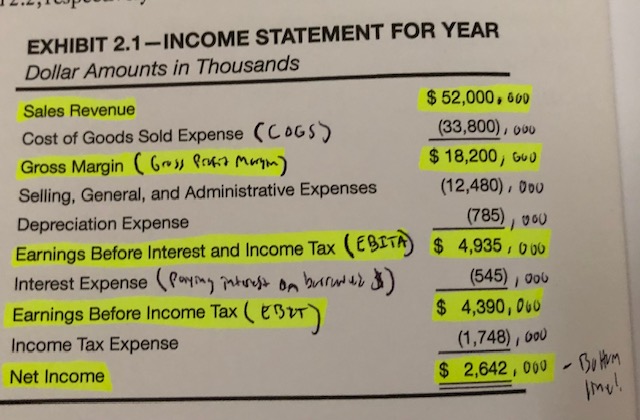
- Shows if the company made a profit or a loss and how much.
- The net income result (or earnings) drives a company’s stock price when earnings are reported each quarter.
- Good Income Statement Analogy: It’s like a flight of stairs. You start with total sales/revenue at the top and slowly deduct expenses with each step until you arrive at net income at the bottom
- All publicly held companies MUST report earnings per share (EPS)
- EPS = Net Income / Common Shares Outstanding
- Shows if the company made a profit or a loss and how much.

- Selling, General, and Administrative (SGA): This is a very broad operating expense. Includes many things grouped into one line item.
- It is every expense other than COGS, interest, and income tax.
- Usually includes things like marketing, wages, R&D, legal fees, etc.
- It is every expense other than COGS, interest, and income tax.
- Balance Sheet
- A balance sheet lists items in the Assets and Liabilities accounts based on nearness to cash.
- Ex. Under assets, the stuff that’s closest to becoming cash (current assets) are listed first.
- That’s why cash is at the top of the balance sheet.
- Ex. The liabilities that are due the soonest are at the top of the Liabilities account
- Ex. Under assets, the stuff that’s closest to becoming cash (current assets) are listed first.
- Current Assets are cash and other assets that will be converted into cash during one operating cycle (60-180 days)
- Marketable securities held as temporary investments and short-term loans that are coming due are included in current assets if they will be converted to cash during the coming year.
- Left side of balance sheet:
- Current assets
- Long term operating assets
- Other assets
- Right side of balance sheet:
- Current liabilities
- Long-term liabilities
- Owners’ equity
- Depreciation is interesting. It’s reported on the income statement each year based on how much the asset or piece of equipment has finished. The equipment and assets themselves are listed on the balance sheet under long-term fixed assets.
- Also the cumulative or built up amount of depreciation since the asset or equipment was acquired is listed on the balance sheet as accumulated depreciation.
- Retained Earnings is what the business keeps after distributing a portion of its net income to shareholders as a dividend.
- A balance sheet lists items in the Assets and Liabilities accounts based on nearness to cash.
- Statement of Cash Flows
- This record is a supplement to the Income Statement and Balance Sheet. It’s not more important but rather an “add on”.
- Three Components:
- Cash Flows from Operating Activities
- Cash Flow from Investing Activities
- Cash Flow from Financing Activities
- Most people only really look at the Cash Flows from Operating Activities
- Accrual vs Cash Accounting
- Accrual: The transactions and events that affect a business are recorded when the event takes place, which may be before or after the cash for the item actually changes hands. It’s recorded immediately.
- P. 25: Shareholders expect managers to earn a reasonable return on equity (ROE).
- To find ROE, divide the total shareholders equity (including Retained Earnings) and divide by Net Income for the year.
- Managers have a three-step task:
- Earn enough profit (Income Statement)
- Control the company’s assets and liabilities (Balance Sheet)
- Generate cash flows (Statement of Cash Flows)
- Total Revenue (Income Statement) and Accounts Receivable (Balance Sheet) have a direct link.
- On a year-end balance sheet, the amount in Accounts Receivable is the amount of uncollected sales revenue at the end of the year. These sales were usually made in the fall, which is why the cash has not been collected yet.
- When a business sells products to customers on credit, there is usually a delay between the time of sale and when the cash reaches the business (usually 5-10 weeks or more).
- Until the credit sale is turned into cash, the amount is recorded in Accounts Receivable. Once it is converted to cash, the amount leaves Accounts Receivable (decreases Accounts Receivable) and increases the Cash account on the balance sheet. So there is a constant rebalancing of Accounts Receivable and Cash on the balance sheet.
- The Accounts Receivable Turnover Rate determines the size of the Accounts Receivable
- Quicker turnover/collection = more cash for the company. The company is converting credit sales to cash quicker. This means the company doesn’t have to borrow and take on as much debt or issue more shares to get more capital. You’d like to see the Accounts Receivable Turnover Rate as a fairly low number of weeks.
- Accounts Receivable Turnover Ratio = Sales Rev/Accounts Receivable
- Then divide that rate into 52 weeks and you get the number of weeks it takes for credit sales to convert to cash.
- Statement of Cash Flows is more of an add on or supplemental document. It shows HOW the business is using its cash.

