How Finance Works
Mihir Desai
 GENRE: Business & Finance
 PAGES: 288
 COMPLETED: June 16, 2022
 RATING:


Short Summary
How Finance Works tackles a broad range of topics, giving readers the knowledge and skills needed to understand how finance works. Harvard Business School professor Mihir Desai details the fundamentals of finance and explains how to value companies.
Key Takeaways


Favorite Quote
"If you want to progress in your career, you’ll need to engage deeply in finance — it is the language of business, the lifeblood of the economy, and increasingly a dominant force in capitalism."
Book Notes 
Introduction
- Authors and Contributors — This book was written by Mehir Desai, but features several contributors in the world of finance.
- Mehir Desai — Wrote the book. He is a professor at the Harvard Business School. Previously, he was an analyst on Wall Street.
- Laurence Debroux — Contributor. She is the CFO at Heineken.
- Paul Clancy — Contributor. Former CFO at Biogen. Was also a high-ranking financial analyst at Pepsi.
- Alan Jones — Contributor. He is the head of private equity and investments at Morgan Stanley.
- Jeremy Mindich — Contributor. Co-founder of Scopia Capital, a multibillion dollar hedge fund in NYC.
- Alberto Moel — Contributor. Previously worked at Bernstein, an equity research analysis firm.
- Quote (P. 3): “If you want to progress in your career, you’ll need to engage deeply in finance — it is the language of business, the lifeblood of the economy, and increasingly a dominant force in capitalism.”
Ch. 1: Financial Analysis
- Financial Analysis — Using a company’s financial numbers and ratios to determine performance, viability, and potential.
- Ratios — Ratios provide a way to easily compare relevant numbers of different companies in an industry. Ratios help you make sense of otherwise meaningless financial accounting numbers.
- You get ratios by taking a number on the income statement or balance sheet (like net income of $100 million) and dividing it by something else (most commonly total sales/revenue). The ratio will allow you to make sense of the $100 million number and understand if it’s good, bad, or OK compared to other firms in the same industry.
- Ratios — Ratios provide a way to easily compare relevant numbers of different companies in an industry. Ratios help you make sense of otherwise meaningless financial accounting numbers.
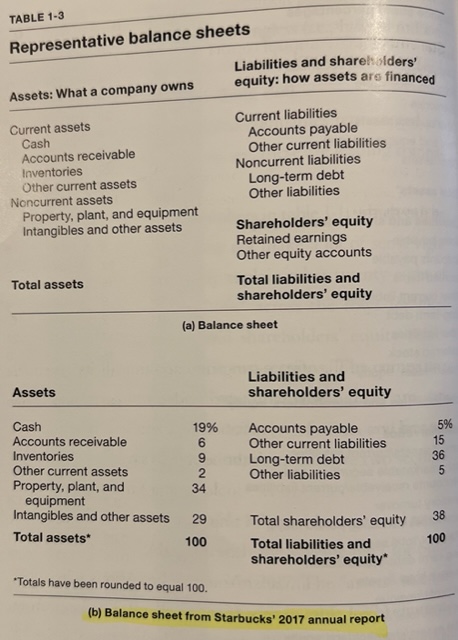
- Balance Sheet — A snapshot of a company’s performance on a given date. Shows the company’s assets, liabilities, and shareholders’ equity. On your personal balance sheet, your personal belongs are your assets. Your credit card debt, student debt, and mortgage would be a liability, and your net worth is what’s left after subtracting liabilities from assets. Net worth and shareholders’ equity are the same thing.
- Formula — Assets = Liabilities + Shareholders’ Equity
- Assets — What a company owns.
- Cash
- Inventory
- Accounts Receivable
- Equipment
- Etc.
- Liabilities and Shareholders’ Equity— How a company finances its assets by borrowing money and/or raising money from shareholders.
- Debt
- Accounts Payable
- Etc.
- Because shareholders’ equity is technically money owed to shareholders, it is considered a liability and is added to total liabilities to equal total assets, which is why the formula will always balance.
- Assets — What a company owns.
- Formula — Assets = Liabilities + Shareholders’ Equity
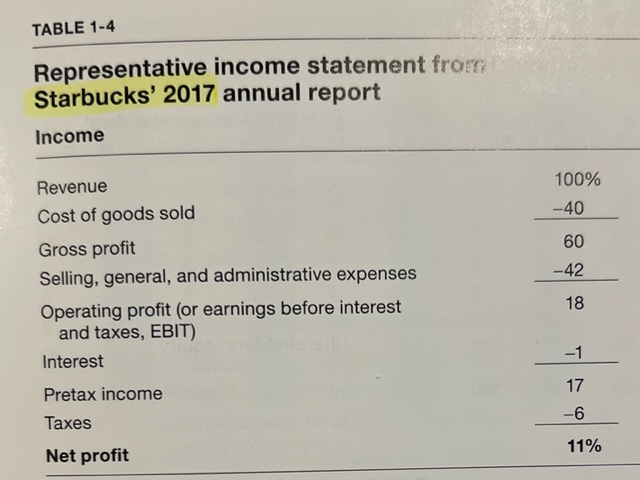
- Income Statement — Shows a company’s net income after taking total sales and subtracting the expenses that go into creating the product t and running the business. An income statement shows how the company performed over a period of time, most commonly a year.
- Personal Example — Using your life as an example, your yearly salary would be total sales/revenue. Costs or expenses would be things like food, housing, gym membership, and so on. What you made for the year would be found by subtracting your costs for the year by your salary on December 31.
- Quote (P. 15): “The best first step when looking at a sea of numbers is to look for extreme numbers and then create a story about these numbers.”
- When conducting analysis, look for numbers that stand out and try to figure out why they are so extreme. There’s a story behind every strange number.
- Balance Sheet: Assets — Assets are what the company owns. They are the company, essentially (Ex. Häagen-Dazs owns the ice cream, factories, and trucks needed to produce and sell its product). They are ordered based on how quickly they can be converted to cash. The numbers presented first are current assets and are the easiest to turn into cash. Categories of assets include:
- Cash & Marketable Securities — Cash is king. You want to see a company have a lot of cash. Marketable securities are like stocks in your investment account; they can be sold and converted to cash with a few clicks. Cash helps the company in three ways:
- Protection during uncertain times.
- War chest for future acquisitions.
- Build up of reserves if there just aren’t any good investment opportunities at the moment.
- Accounts Receivable — Amounts that a company expects to receive from its customers in the future. What is owed to the company, essentially. Companies sometimes make sales by extending credit, allowing customers 30, 60, or 90 days to pay.
- Cash & Marketable Securities — Cash is king. You want to see a company have a lot of cash. Marketable securities are like stocks in your investment account; they can be sold and converted to cash with a few clicks. Cash helps the company in three ways:
- Ex. Walmart — Accounts receivable of $5.6 billion in 2016, which was 1.1% of sales.
- Ex. Staples — Accounts receivable of $1.4 billion in 2016, which was 6.7% of sales.
- Ex. Intel — Accounts receivable of $4.8 billion in 2016, which was 8.9% of sales.
- Intel had the highest percentage of account receivable of the three examples because it sells mostly to other businesses. Walmart and Staples, for the most part, deal with customers primarily.
- Inventory — The goods that a company intends to sell. Raw materials, products that are being completed, and finished goods are all considered inventory. Service companies will have low or no inventory.
- Ex. Häagen-Dazs — The ice cream, chocolate, and coffee beans it uses to make its products.
- Other Assets — These are mostly intangible assets, things like patents, brands, and goodwill. Interestingly, because these are hard to value, they don’t really come into play unless one company acquires another.
- Goodwill — A subcategory of ‘Other Assets.’ If Company 1 buys Company 2 by paying more than the book value of assets on Company 2’s balance sheet, the excess is usually recorded as goodwill on Company 1’s balance sheet. Company 1 essentially paid a little extra for Company 2’s brand name.
- Ex. Microsoft — In 2016, Microsoft bought LinkedIn for $26.2 billion, which was $19.2 billion more than what LinkedIn’s book value of assets was listed at ($7 billion). This excess $19.2 billion then shows up on Microsoft’s balance sheet in the ‘Other Assets’ and ‘Goodwill’ category. It obviously wasn’t valued at $19.2 billion on LinkedIn’s balance sheet before the acquisition though. Interesting how that works.
- Goodwill — A subcategory of ‘Other Assets.’ If Company 1 buys Company 2 by paying more than the book value of assets on Company 2’s balance sheet, the excess is usually recorded as goodwill on Company 1’s balance sheet. Company 1 essentially paid a little extra for Company 2’s brand name.
- Balance Sheet: Liabilities & Shareholders’ Equity — This section of the balance sheet is all about how a company pays for its assets/raises money. There are only two sources for raising money/capitalizing: lenders and owners. Debt has a fixed interest cost, while equity holds a fluctuating variable rate of return with ownership rights. The ‘Liabilities’ area shows what the company owes to debt-holders. The ‘Shareholders’ Equity’ area shows the amount shareholders provide to the company and is owed to shareholders. Liabilities are ordered based on the amount of time a company has to pay them; liabilities that are owed back soonest are listed first as ‘Current Liabilities.’
- Accounts Payable & Notes Payable — ‘Accounts Payable’ shows what a company owes to another company in the next 30-90 days. It has bought items from suppliers using credit and needs to pay up soon. ‘Notes Payable’ represents short-term debt that a company has to pay back to lenders in the next 30-90 days. It is bonds that are coming due soon.
- Ex. Intel — Intel had a high percentage of ‘Accounts Receivable.’ Dell and Lenovo frequently buy Intel’s chips, so these two companies are likely high in ‘Accounts Payable’ with most of it being owed to Intel.
- Accrued Items — Amounts due to others for activities already delivered.
- Ex. Salaries — A balance sheet might be produced during the middle of a pay period and a company may owe salaries that haven’t been paid yet.
- Long-Term Debt — Long-term debt is debt you typically hope a company avoids. Debt is money borrowed from banks or other lenders. It comes with an interest rate that must be paid, along with the principal when it comes due. Lenders are owed money before shareholders (owners) if the company goes bankrupt.
- Cash Helps — Financial analysts look at cash as “negative debt” because it can be used to immediately pay off debt, if needed. So, if 29% of a company’s liabilities are tied up in debt, but the company has 20% of its assets in cash, the company really has about 9% of debt. Cash is important to watch when comparing the debt levels of different companies.
- Preferred & Common Stock — This is essentially ‘Shareholders’ Equity.’ These are equity instruments that a company can use to raise money from owners/shareholders. Shareholders are considered owners of the company. Preferred stock is a hybrid between a bond and a common stock and pays a fixed dividend, but is convertible to common stock if the company does well. Preferred stockholders get paid before common stockholders (but after lenders) in the event of bankruptcy.
- Accounts Payable & Notes Payable — ‘Accounts Payable’ shows what a company owes to another company in the next 30-90 days. It has bought items from suppliers using credit and needs to pay up soon. ‘Notes Payable’ represents short-term debt that a company has to pay back to lenders in the next 30-90 days. It is bonds that are coming due soon.
- Financial Ratios — Ratios are the language of business. Ratios make numbers meaningful by providing comparability across companies and through time.
- Ex. Coca-Cola — Coke had $7.3 billion of net income in 2016. Ok, so? When you then divide Coke’s net income by total revenue, you find that Coke’s net income was 16% of its total sales. This is much more useful and allows you to then compare that to other companies in the industry and to Coke’s past performance in years prior.
- Ex. Coca-Cola — Coke had $64 billion in total liabilities in 2016. Ok, so? When you divide Coke’s total liabilities by total assets, you find that 71% of its assets were financed using liabilities. This is very useful to know.
- Liquidity Ratios — These show how liquid a company is or how quickly the company can generate cash to pay off short-term obligations.
- Current Ratio — Shows a company’s ability to pay off current liabilities using current assets. Essentially, how well the company can pay its bills.
- Formula: Current Assets / Current Liabilities
- Quick Ratio — A more intense edition of the current ratio. It removes inventory, which varies in value and can be risky, from the picture.
- Formula: (Current Assets – Inventory) / Current Liabilities
- Current Ratio — Shows a company’s ability to pay off current liabilities using current assets. Essentially, how well the company can pay its bills.
- Profitability Ratios — These ratios provide insight and comparability regarding profitability. It’s not enough to just know that a company made a certain amount of net income for the year.
- Profit Margin Ratio — Reveals how much a company ultimately kept on its sales after subtracting COGs, administrative expenses, interest, and taxes. For every $100 of sales, the company was able to keep $XX.
- Formula: Net Income / Total Revenue
- Gross Profit Margin Ratio — For every $100 of sales, the company was able to keep $XX after subtracting the costs of making the product (COGS).
- Formula: (Total Revenue – COGS) / Total Revenue
- Return On Equity (ROE) Ratio — Shows the annual return shareholders earned for their investment in the company. For every $100 of net income, a shareholder made $XX.
- Formula: Net Profit / Shareholders’ Equity
- Return on Assets Ratio — Measures how effectively a company is using its assets to produce net income. For every $100 of assets, the company made $XX of net income.
- Formula: Net Income / Total Assets
- EBITDA Margin Ratio — Shows how much a company made on its total revenue before Interest, Taxes, Depreciation, and Amortization. For every $100 of sales, the company made $XX before Interest, Taxes, Depreciation, and Amortization.
- Formula: EBITDA / Total Revenue
- This ratio is key because companies are taxed differently in various industries and countries. By taking this ratio, you cut out a lot of weird things that can affect net income. The ratio allows you to take a strict look at how a company is operating.
- EBIT — Earnings before interest and taxes. This is basically ‘Operating Income’ on the income statement.
- DA — Depreciation and Amortization. Depreciation is how a company’s physical assets (like vehicles and equipment) lose value over time. Amortization is the same thing but for intangible assets. Companies have to judge how much value each of these lost for the year based on a lifespan formula and then charge themselves an annual expense for it on the income statement.
- Profit Margin Ratio — Reveals how much a company ultimately kept on its sales after subtracting COGs, administrative expenses, interest, and taxes. For every $100 of sales, the company was able to keep $XX.
- Financing & Leverage Ratios — Leverage is one of the most powerful concepts in finance. Just as a lever lets you move a rock you couldn’t otherwise move, leverage in finance allows owners to control assets they couldn’t otherwise control. It’s the idea of taking on debt. Leverage magnifies your returns in both directions. Banking companies typically have the highest amount of leverage because they lend money for a living.
- Ex. Mortgage — If you only had $100 to buy a new house, without leverage, you would only be able to buy a $100 house. With leverage, you can buy a $500 house, for example. When the $500 house appreciates in value, you’re then earning more of a return on your $100 investment than if you only had the house that was worth $100.
- Debt to Assets Ratio — This ratio shows you what percentage of assets are financed using debt.
- Formula: Total Debt / Total Assets
- Interest Coverage Ratio — Measures a company’s ability to make interest payments from its operations and uses only data from the income statement.
- Formula: EBIT / Interest Expense
- Quote (P. 42): “With high business risk, there should be low financial risk. That’s the pattern we see in leverage more generally.”
- Ex. Intel — Intel has a somewhat risky business model. The company makes chips every few years that are expected to be lightyears ahead of the previous chip. They invest billions of dollars into making these chips. If one chip release goes wrong, they could be out of business. As a result, the company usually doesn’t borrow a lot of money; its leverage is low.
- Ex. Stable Companies — Companies that have reliable, stable sources of cash flow are able to take more risks and take on more debt/leverage.
- Productivity Ratios — These measure how well a company uses assets to produce output. Productivity is all about maximizing operational efficiency.
- Asset Turnover Ratio — Shows how effectively a company is using its assets to generate revenue.
- Formula: Revenue / Total Assets
- Inventory Turnover Ratio — Shows how many times a company turns over or sells its inventory in a year. The higher the number, the faster a company is getting through its inventory.
- Formula: COGS / Inventory
- Days of Inventory Ratio — Provides the average number of days a piece of inventory is kept inside a company before it is sold. The inventory is turned over every XX days.
- Formula: 365 / Inventory Turnover Ratio
- Receivables Collection Period — Shows how quickly a company collects money from its buyers. The lower the number, the faster the company is collecting money. Typically, companies that sell directly to customers are going to have a low collection period. Companies that instead sell primarily to other businesses will have a higher collection period.
- Formula: 365 / (Sales / Receivables)
- Asset Turnover Ratio — Shows how effectively a company is using its assets to generate revenue.
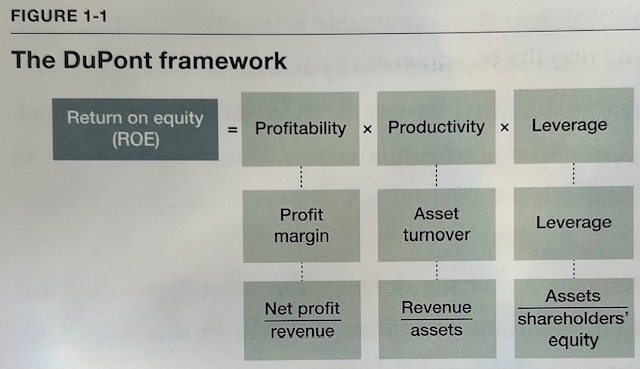
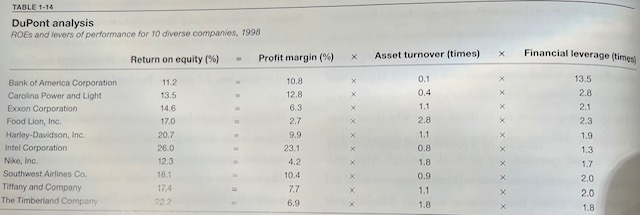
- The DuPont Framework — ROE is considered by analysts as one of the most important ratios to watch because it shows how well management is making decisions and how efficiently the company is delivering a return back to shareholders. The DuPont Framework shows HOW a company is producing its ROE. It was introduced by DuPont Corporation in the early 20th Century and breaks ROE into three categories:
- Profitability — Uses the net profit ratio to measure how well the company is producing a profit.
- Productivity — Uses the asset turnover ratio to measure how well the company is using assets to make sales.
- Leverage — Uses the asset to shareholders’ equity ratio to measure how well a company is using leverage.
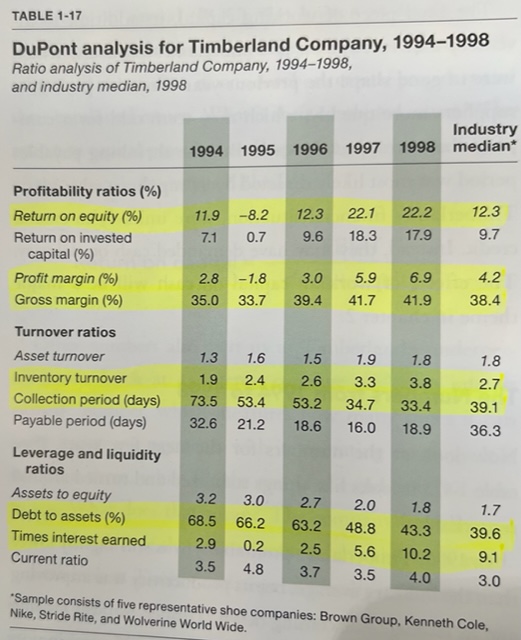
- Case Study: Timberland — Timberland went from nearly collapsing entirely in 1995 to thriving by 1998. The financial numbers show how the company was able to turn it around.
- 1994 — ROE was in line with the industry average, but the DuPont Framework showed that the company’s ROE was coming from the wrong place — leverage. Over 68% of its assets were financed using debt, the industry average was 39%.
- 1995 — Near-death. ROE dropped significantly to -8.2%. The company’s Times Interest Earned ratio fell from 3.2 to 0.2, meaning it was barely able to pay off interest on its debt. To survive and raise cash, it had to sell a bunch of inventory for cheap and make bad deals.
- 1996-98 — The rebound. The company went from family operated to professionally operated and became the chosen brand for hip-hop artists. By 1998, the company’s ROE was almost double the industry average (22.2% compared to 12.3%), and the ROE was coming mostly from profitability. It was also turning over inventory almost twice as much as it was in 1994, meaning it was selling its products at a more efficient rate. By 1998, the company had also reduced its debt a ton and its Times Interest Earned skyrocketed to 10.2.
Ch. 2: The Finance Perspective
- Valuation Keys — Financial statements are critical to look at. Analysts particularly like to look at two key areas when evaluating a company:
- Cash — Financial analysts pay a lot of attention to a company’s cash position. There are three key cash-related figures to watch:
- EBITDA
- Operating Cash Flow
- Free Cash Flow (considered “financial nirvana”)
- The Future — Analysts love to look at the future and find ways to evaluate future cash flows by translating them to the present.
- Cash — Financial analysts pay a lot of attention to a company’s cash position. There are three key cash-related figures to watch:
- Quote (P. 54): “Emphasizing only the growth of revenues can be ridiculous and dangerous. Measuring only the growth of profits would also be dangerous. Cash is the most important. Your capacity to transform your business into cash that you can use to finance your activities, repay your debt, or distribute to your shareholders is the key.”
- Cash is the fuel and lifeblood of any business. This is a number you want to pay very close attention to. Growing cash allows the company to do a lot of different things to help the business and shareholders.
- Companies that don’t produce net income, or barely produce any net income, but produce a lot of cash are still good investments. Companies that are raising their cash number over time are valuable.
- EBITDA — This is ‘operating profit’ on the income statement. This number is important because it shows how a company performed before accounting for interest, taxes, depreciation, and amortization. Based on industries and a company’s capitalization decisions, interest and taxes can have a big impact on net income. By looking at EBITDA, you’re comparing companies strictly on how well they operate.
- Ex. Amazon — In 2014, Amazon reported a net income of -$241 million but it’s EBITDA was $4.924 billion. Interest, taxes, depreciation, and amortization made it look like Amazon was performing really bad when that really wasn’t the case at all.
- Operating Cash Flow — Found in the first part of the cash flow statement. It closely follows cash as it moves through the operating cycle. One of the big items it factors in is ‘Working Capital.’
- Working Capital — The capital that companies use to fund their day-to-day operations. If Working Capital is lowered, that lowers the financing needs of the company.
- Formula — Current Assets – Current Liabilities
- Cash Conversion Cycle — Some powerful companies are able to use working capital and their cash conversion cycle to fund their operations. By collecting from customers before paying suppliers, they are able to use inbound cash from customers to fund operations. Depending on the interest rates and financing options available in the market, this could be a huge advantage.
- Ex. Amazon — In 2014, Amazon averaged 46 days of inventory and collected from customers every 21 days. It paid suppliers every 91 days. That’s a ‘negative cash conversion cycle.’
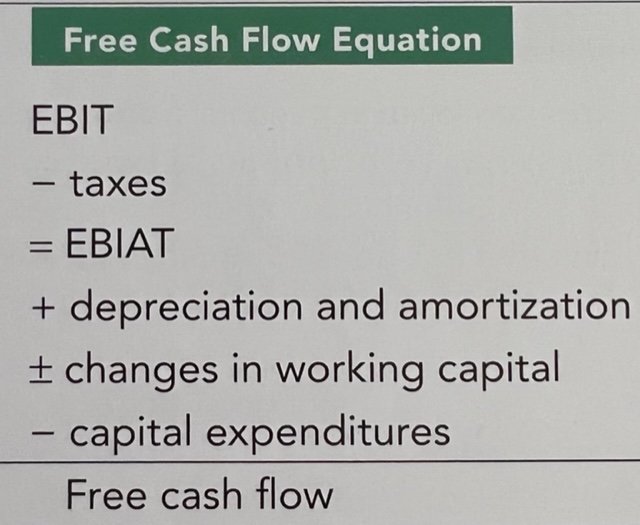
- Free Cash Flow — Considered one of the most important financial measures of a company’s performance. It is the purest measure of cash and is crucial to valuing a company. In short, free cash flow isolates the cash that is truly free to be used by the company in any way it sees fit. The company can do a lot with free cash flow including:
- Invest in the growth of the company via new products or expanding into new locations
- Share buybacks
- Pay dividends
- Fixated On The Future — Analysts like to predict future cash flows of a business and discount the cash flows back to the present when valuing a company. They try to figure out what the company will generate in the future and determine what that is worth NOW.
- Time Value of Money — A key aspect of the discounting process, $1 today is worth more than $1 a year from now. This is because you can do something with that $1 today to earn more than $1 a year from now. Therefore, you have to apply a discount rate to the future cash flows.
- Discount Rate — Applying a penalty or “punishment” to the future cash flows because they are costing you something now. It’s the cost of waiting. The discount rate is essentially the interest rate in the market because that’s what you could be earning on your money NOW. For the company, this number/percentage is its cost of capital.
- Formula: Cash Flow / (1+r) where r = interest rate
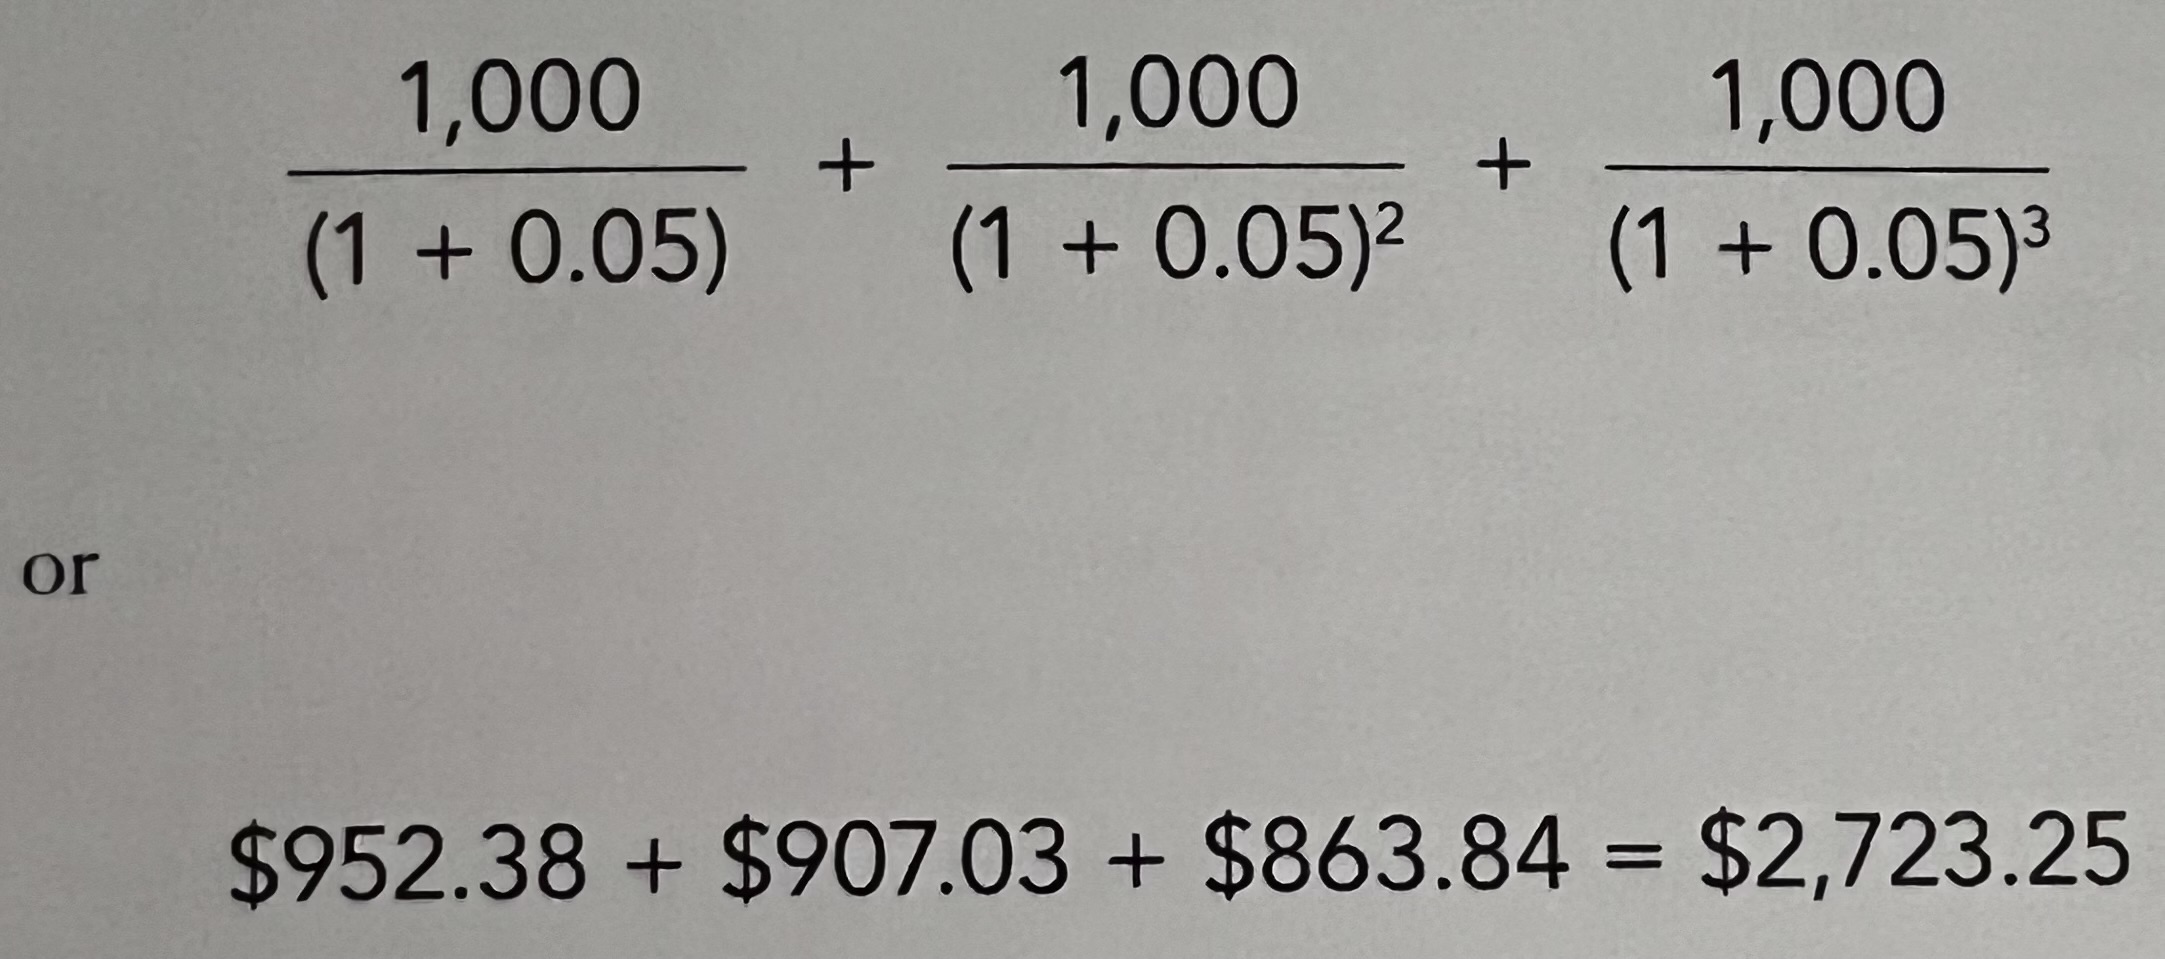
- Ex. $1,000 — If you were offered $1,000 in a year, what is that worth to you today with a bank offering you 5% interest rate on your money right now? You would discount/punish the $1,000 using the ‘Discount Formula.’ That $1,000 would have a present value of $952.38 ($1,000 / 1.05). The formula punishes the future money more when interest rates are higher because your opportunity cost is greater with higher interest rates.
- Multiple-Year Discount Rate — If you want to discount cash flow over multiple years back to its present value, use the following formula.
- Discount Rate — Applying a penalty or “punishment” to the future cash flows because they are costing you something now. It’s the cost of waiting. The discount rate is essentially the interest rate in the market because that’s what you could be earning on your money NOW. For the company, this number/percentage is its cost of capital.
- Time Value of Money — A key aspect of the discounting process, $1 today is worth more than $1 a year from now. This is because you can do something with that $1 today to earn more than $1 a year from now. Therefore, you have to apply a discount rate to the future cash flows.

- Net Present Value — Critical for managers to understand before pursuing a project. After you’ve discounted future cash flows and found their present value, it’s time to consider the cost of the project. By subtracting the total present value of the cash flows by the project cost, you get ‘Net Present Value’, which will tell you if the project is worth pursuing or not. If the net present value is positive, do the project. If not, don’t do it.
- Ex. Nike — Nike is building a new shoe factory that will cost $75 million to build. The plant will produce $25 million in cash every year for the next five years from the shoes Nike can make in the factory. The discount rate is 10%. After running the calculations, the present value of the project is $94.8 million. By subtracting $75 million from $94.8 million, we get $19.8 million net present value. Nike will generate $19.8 million in additional value via this project. This project should be pursued.
- Quote (P. 80): “You can look at all kinds of metrics to see how the company is growing. Does that generate cash? If it does, you’re good. If not, you’ve got a problem… Ultimately, valuation is all about discounted cash flow. It is not discounted earnings flow. It’s cash flow. Because I put some cash in, I want it back with a return. That’s why discounted cash flow is everything.”
- When you invest in a company, you want your money back with a return. Cash is essential to that. A company needs to be generating cash that it can then dish out to shareholders.
- Discounted cash flow is a big part of every analyst’s valuation process.
Ch. 3: The Financial Ecosystem
- Capital Market: Buy Side — The capital market is tricky and involves a lot of different players. Some of these on the “buy side” include:
- Institutional Investors — Entities that invest a large amount of money on behalf of others. There are a lot of different kinds of institutional investors, including:
- Mutual Funds — Manage money on behalf of people and invest in a diversified portfolio of stocks or bonds. Diversification is the key with mutual funds. Mutual funds attempt to twice risk via diversification. There are two types:
- Active — Managed by a person. A person selects the stocks in the mutual fund.
- Passive — Index funds and ETFs. These are not managed. Instead, the fund “tracks” a broad market index, like the S&P 500. These have become very popular recently.
- Mutual Funds — Manage money on behalf of people and invest in a diversified portfolio of stocks or bonds. Diversification is the key with mutual funds. Mutual funds attempt to twice risk via diversification. There are two types:
- Pension Funds — Large pools of money that represent the retirement assets of workers from a company, union, or government entity. Two types:
- Institutional Investors — Entities that invest a large amount of money on behalf of others. There are a lot of different kinds of institutional investors, including:
- Defined Benefit Plan — Employees receive payments AFTER retirement.
- Defined Contribution Plan — Employees receive a contribution from their employers in their pension plan. The employee manages the pension account.
- Hedge Funds — Similar to mutual funds, but are not as highly regulated and use a lot of leverage and risk. Only “sophisticated investors” (rich people) can participate, hence the poor regulation. Hedge funds attempt to use shorting, derivatives, and other means to offset risk.
- Equity Analysts — These analysts speak to companies and other players in the capital market system and assess ratings and recommendations to investors. They are heavily compensated based on their analyst “ranking”, which is given out by firms on the buy side.
- Incentives — Because analysts are compensated largely based on their ranking, they are incentivized to please companies and buy side firms to get the best ranking possible. This means they don’t issue “sell” recommendations as much as they probably should. They have to be careful. This is especially true for analysts that have a high ranking — they don’t want to lose it.
- Managers and Leadership — Every move made by managers and top leadership at big companies is heavily evaluated. The actions made by these people are important because they have the most information about the company. They know more than everyone else.
- Ex. Raising Equity — When a company attempts to raise money by offering more shares in the market, the move is usually met with some skepticism because, if the project the company is raising money for is so great, why would the company want to give away ownership by issuing more shares?
- Ex. Selling Shares — When a manager sells a lot of shares, that’s usually a really bad sign. They would only be selling shares in huge bulk if they knew the company was headed for trouble.
- Ex. Share Buybacks — When a company buys back its own shares, it’s a great sign because it signals that management believes shares in the company are currently undervalued. Otherwise, they wouldn’t do it.
- Asymmetric Information — Refers to the information gap between managers of companies and investors. You just don’t know if what managers are saying can be fully trusted. You don’t know what kind of information they are hiding or what kind of incentives they are operating with. This issue is one of the bigger issues in the capital market.
Ch. 4: Sources of Value Creation
- ROE and Cost of Capital — If a company can’t produce an ROE that exceeds its cost of capital, nothing good has been done. No value has been created. A great company will make good decisions and put its cash to good use, generating a nice ROE that exceeds its cost of capital. When this happens, the stock price rises.
- Cost of Capital — The percentage return that investors are looking for. This expected number/percentage return will depend on the company’s level of risk. Investors want greater returns for greater risk. If investors are expecting a 15% return on their investment, that’s the company’s cost of capital. This cost of capital number is what you use to discount (or “punish”) future cash flows when finding the present value.
- Ex. Value Creation — A company produces a 20% ROE with a cost of capital of 15%. That’s a nice return that produces value. A company can only create value if it is consistently generating returns to investors that exceeds its cost of capital.
- Creating Value — There are three ways companies can create value, which will drive the stock price up. These include:
- Cost of Capital — The percentage return that investors are looking for. This expected number/percentage return will depend on the company’s level of risk. Investors want greater returns for greater risk. If investors are expecting a 15% return on their investment, that’s the company’s cost of capital. This cost of capital number is what you use to discount (or “punish”) future cash flows when finding the present value.
- ROE > Cost of Capital
- ROE > Cost of Capital for many years
- Reinvest additional profit back into the company at high rates of growth (reinvest at a high ROE).
- Weighted Average Cost of Capital (WACC) — Gives a company’s average cost of capital, which includes debt and equity. Again, the cost of capital is the expected return from investors. Some of the components of the formula include:
- Cost of Debt — The interest rate that banks charge companies after analyzing riskiness of the business, stability of cash flow, and credit rating. The interest rate that a company is charged has two components:
- The Risk-Free Rate —The return a US Treasury Bond (T-Bond) will provide. The returns on these securities are essentially guaranteed, which is why the return these bonds produce is used as a risk-free benchmark. Everything else has to have a return that exceeds this.
- Credit Spreads —The difference between the interest rate a company will pay on its bonds and the risk-free rate on a U.S. Treasury Bond. The riskier the company, the more interest it needs to pay on its bonds to entice investors. Also, longer term bonds need to deliver greater returns to compensate investors for attaching themselves to a fixed interest rate for so long when interest rates could swing upward at any time.
- Ex. Walmart — In 2018, Walmart paid an interest rate of 3.55% on its AA-rated bonds. At the time, T-Bonds were laying a 2.96% return, implying a credit spread of 0.59%.
- Cost of Equity — Much like the cost of debt, the cost of equity refers to the rate of return equity investors expect back from their investment. The riskier the company, the greater the expected return.
- Optimal Capital Structure — This refers to a company’s perfect blend of equity and debt financing. Optimal capital structure depends on the company and the industry; companies in industries with predictable, steady cash flows are able to take on more risk by issuing more debt while companies in industries that are risky need to avoid debt and raise money via equity.
- Systemic Risk — Refers to the overall risk of investing in the stock market. This can’t be reduced via diversification.
- Beta — Basically a measure of volatility. Measures the correlation between a company’s returns and the market’s returns. The higher a company’s beta, the more volatile and risky it is, which leads to investors requiring greater returns as compensation for that additional risk.
- Ex. 1 — If a company has a beta of 1, it moves exactly in sync with the market. If the market moves 10%, the company’s stock moves 10%.
- Ex. 2 — If a company has a beta of 2, it moves twice as much as the market. If the market goes up 10%, the company’s stock goes up 20%.
- Ex. -1 — If a company has a beta of -1 and the market goes up by 10%, the company’s stock will go down by 10%.
Ch. 5: The Art and Science of Valuation
- Valuation — Valuing any asset, whether it be a company, a house, or anything else, is somewhat subjective; there is no “perfect way” to go about the valuation process. That said, there are two important valuation methods:
- Multiples
- Discounted Cash Flows
- Multiples — These are ratios that compare the value of an asset to an operating metric associated with that asset. One of the best is the P/E Ratio.
- P/E Ratio — This multiple gives you a quick read as to whether the stock is overpriced or underpriced in the market compared to other companies in the same industry. It tells you: “This stock is trading at XX times earnings.” It can also be thought of as: “For every $1 of the company’s earnings, I am paying $XX.” This ratio should be thought of with the future in mind. When a company has a high P/E ratio, it means that investors are willing to pay a high market price (for low earnings right now) in order to get in on the stock early with the expectation that earnings will grow significantly in the future and “catch up” to the market price. A high P/E usually means the company is being overvalued by investors. A low P/E signals that the stock is undervalued.
- Formula — Market Price of Stock / Earnings Per Share (Net Income / # of Shares Outstanding)
- Ex. Apple (P/E of $22) — Apple stock is trading at 22 times its earnings. I am paying $22 for every $1 of the company’s earnings.
- Concerns — There are a few concerns with using P/E as a valuation tool. The primary concern is that net income, and therefore EPS, can be altered significantly (as we have read already) by depreciation, amortization, taxes, and interest.
- Price Per Square Foot — A multiple used to evaluate home prices. You can compare the price per square foot of homes in a neighborhood.
- Formula — Market Price / House Size (In Square Feet)
- Concerns — Like all multiples, this ratio has limits. Specifically, ignores other key factors of buying a house, including neighborhood quality, view, and more.
- P/E Ratio — This multiple gives you a quick read as to whether the stock is overpriced or underpriced in the market compared to other companies in the same industry. It tells you: “This stock is trading at XX times earnings.” It can also be thought of as: “For every $1 of the company’s earnings, I am paying $XX.” This ratio should be thought of with the future in mind. When a company has a high P/E ratio, it means that investors are willing to pay a high market price (for low earnings right now) in order to get in on the stock early with the expectation that earnings will grow significantly in the future and “catch up” to the market price. A high P/E usually means the company is being overvalued by investors. A low P/E signals that the stock is undervalued.
- Discounted Cash Flows — Considered the “Gold Standard” of valuation. Involves projecting a company’s cash flow out into the future and then discounting them back to find the present value of those future cash flows. It is a combination of what was discussed in chapters 2, 3, and 4.
- Quote: (P. 160): “From chapter 2, we know that assets derive their value from their ability to generate future cash flows, and those cash flows aren’t all created equal — they require discounting to translate them to today’s numbers. From chapter 4, we know that the appropriate discount rate is a function of investors expected returns as they translate into my managers cost of capital.”
Ch. 6: Capital Allocation
- Capital Allocation — Refers to what companies should do with free cash flow. Companies can reinvest excess cash back into the business, issue a dividend, engage in a share buyback plan, or use it to acquire another business.
- Quote (P. 190): “The first question a manager has to address involves the availability of positive net present value (NPV) projects to spend money on. Creating value is central to a manager’s task, and that process involves beating the cost of capital, year over year, and growing. If positive NPV projects are available to you, then you should undertake them. Those projects may involve organic growth — introducing new products or buying new property, plant, equipment — or inorganic growth via mergers and acquisitions. If there aren’t value-creating opportunities — that is, projects with positive NPV — then a manager should distribute the cash to shareholders through dividends or share buybacks.”
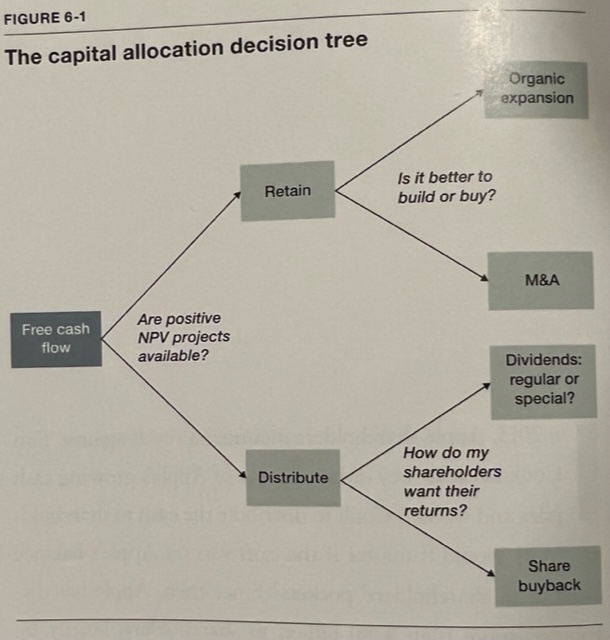
- Growth — If the company is going to retain cash and invest it back into the business in some way, the projects need to have a positive NPV. Otherwise, the money should be distributed to shareholders via a dividend or share buyback.
- Distributing to Shareholders — If no positive NPV projects are available to grow and expand the company, the business should distribute cash back to shareholders. There are two ways:
- Dividend — A fixed percentage yield issued quarterly by the company to investors. A company will always try to avoid reducing its dividend because it would get slammed by analysts and the media if it did that.
- Share Buyback — Occurs when a company buys its own shares in the market, therefore reducing the number of shares outstanding and giving existing investors a larger ownership percentage. The price per share usually jumps up when a company engages in a share buyback because it’s a sign that the company believes it’s shares are undervalued. The company would never buy its own shares if management didn’t believe that. Investors take the signal and buy shares of the company as well, which drives up the price.
- Quote (P. 201): “If the people with all the information about the company are buying back shares, they must think the firm is undervalued and are willing to put real money behind that sentiment. This decision is a very strong signal and helps explain why buybacks have become so popular and are often greeted with a price rise.”

